Alcohol And Road Traffic Crashes
The information given in Table 1 below is reported by the SAPS on “Quick Response Fatal Accident forms” to the National Fatal Accident Information Centre (NFAIC) of the Road Traffic Management Corporation (RTMC), which includes a summary of the suspected contributory human, vehicle and road factors to each accident, and which provide for the indication of drivers of vehicles and pedestrians suspected to be under the influence of alcohol at the time of the accident.
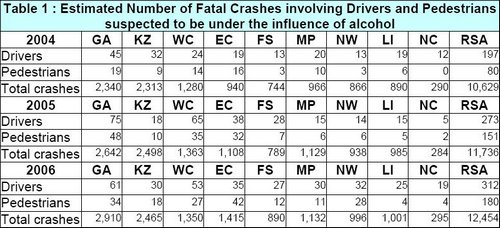
The information in Table 1 above shows that, on a national basis :
(a) the number of fatal road accidents in which drivers are suspected to be under the influence of alcohol increased from 197 in 2004 to 273 in 2005 and to 312 in 2006; and
(b) the number of fatal road accidents in which pedestrians are suspected to be under the influence of alcohol, increased from 80 in 2004 to 151 in 2005 and to 180 in 2006.
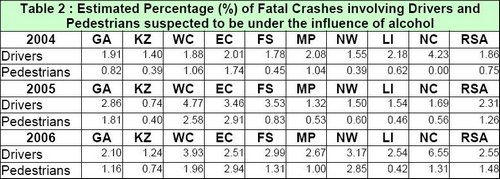
The estimated percentage (%) of fatal crashes, expressed as a percentage of the total number of fatal crashes for the particular year,
(a) in which drivers are suspected to be under the influence of alcohol increased from 1,86% in 2004 to 2,31% in 2005 and to 2,55% in 2006; and
(b) the number of fatal road accidents in which pedestrians are suspected to be under the influence of alcohol increased from 0,75% in 2004 to 1,26% in 2005 and to 1,48% in 2006.
The 2002/2003 And 2005/2006 Road Traffic Offence Survey Reports
2. A service provider was appointed to undertake surveys of serious road traffic offences countrywide. Surveys were undertaken during 2002, 2003, 2005 and 2006.
Based on the results of the annual road traffic offence survey reports for 2002, 2003, 2005 and 2006, I have extracted the information on test results for drivers which was found driving while exceeding the legal breath alcohol limit. These results for the four years, during day-time and night-time respectively, are summarized in Table 3 (daytime) and Table 4 (night-time) below. The legal limit is 0,24mg/litre for drivers of light motor vehicles and 0,1mg/litre for professional drivers (minibus taxis, buses and trucks).
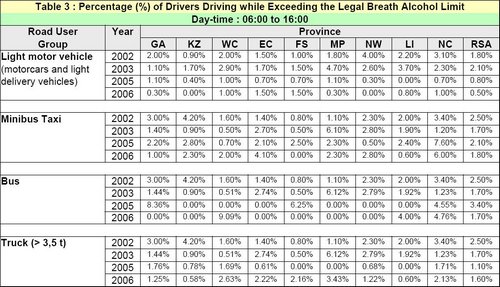
The information in Table 3 above shows that on a national basis during day-time for light motor vehicles, the percentage of drivers driving while exceeding the legal breath alcohol limit, increased from 1,80% in 2002 to 2,10% in 2003. This percentage decreased to 0,80% in 2005 and further decreased to 0,50% in 2006. The percentage of drivers of buses driving while exceeding the legal breath alcohol limit during day-time, decreased from 2,50% in 2002 to 1,70% in 2003. This percentage increased to 3,40% in 2005 and again decreased to 1,70% in 2006.
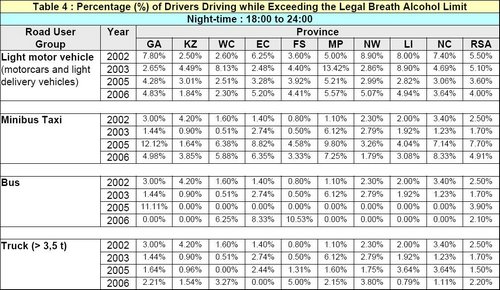
The information in Table 4 above shows that on a national basis during night-time for drivers of light motor vehicles, the percentage driving while exceeding the legal breath alcohol limit, decreased from 5,50% in 2002 to 5,10% in 2003. This percentage further decreased to 3,60% in 2005 and again increased to 4,00% in 2006. The percentage of 3 drivers of minibus taxis driving while exceeding the legal breath alcohol limit during night-time, decreased from 2,50% in 2002 to 1,70% in 2003. This percentage increased to 7,70% in 2005 and again decreased to 4,91% in 2006.
3. Of particular concern is the fact that driver alcohol levels in all provinces at night-time were extremely high when compared to acceptable international standards which reflects a very serious concern when the legal limit is exceeded by more than 0,5% of drivers.
The Report Of The Medical Research Council Of South Africa (“the MRC report”)
4. In 2004 the MRC compiled a report pertaining to the number of people killed in road accidents, whose blood alcohol exceeded 0,05g/100ml. In this 6th Annual Report of the National Injury Mortality Surveillance System (NIMSS), the fatalities are grouped per “road user group” namely, drivers, passengers, pedestrians and cyclists.
5. The following table (Table 5), which I have obtained from the above MRC report, reflects the percentage of various road user deaths involving alcohol. As is evident from this table, the blood alcohol concentration (BAC) of just more than half (50,88%) of the 570 drivers killed in accidents and tested after their death by the MRC during 2004, exceeded the legal blood alcohol limit. (It is estimated that 3,358 drivers were killed in road accidents during 2004 of which 570 or 16,97% were tested by the MRC at 35 mortuaries around the country). The mean BAC of drivers exceeds the legal limit of 0,05g/100ml by between 3 to 4 times.

NUMBER OF DRIVER AND PEDESTRIAN FATALITIES
6. The number of drivers and pedestrians killed in road accidents per annum over the three (3) year period from 2004 to 2006, is given in Table 6 below.

If the percentage of drivers (50,88%) and pedestrians (59,72%) killed in road accidents, as found in the MRC study report that exceeded the legal blood alcohol limit in Table 5, are applied to the figures in Table 6 above, the estimated number of drivers and pedestrians killed using the road whilst under the influence of alcohol over the 3 year period, is shown in Table 7 below.
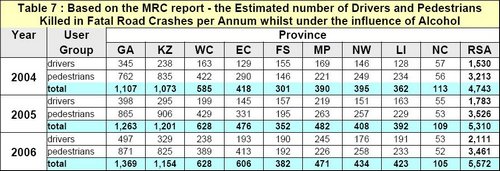
Based on the figures in Table 7 above, the estimated number of hours between intoxicated driver and pedestrian fatalities respectively, is shown in Table 8 below.
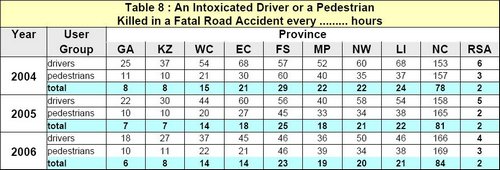
The information in Table 8 shows, for example, that during 2004 in Gauteng a driver of a vehicle under the influence of alcohol was killed every 25 hours. In 2005 this estimated figure changed to a driver killed every 22 hours and in 2006 further reduced to an intoxicated driver fatality every 18 hours. On a national basis an intoxicated driver fatality occurred every 4 hours during 2006.
Click here to download PDF
Tell A Friend